Best Forex Trading Apps and Platforms for Indian Traders
Discover the top-rated Forex trading platforms that comply with Indian regulations and offer the tools you need for successful trading.
Read MoreMaster the essential technical analysis tools that will help you make informed trading decisions in the Forex market

Welcome to our comprehensive guide on technical analysis tools for Forex trading. As a beginner, navigating the complex world of currency trading can be overwhelming, but mastering these essential tools will give you a solid foundation to analyze price movements, identify trends, and make informed trading decisions.
Technical analysis is the study of historical price data to forecast future price movements. Unlike fundamental analysis which focuses on economic factors, technical analysis relies on charts and indicators to identify trading opportunities. In this guide, we'll cover the must-know tools that every Forex trader should have in their arsenal.
While technical analysis is powerful, successful traders often combine it with fundamental analysis and proper risk management. Never rely on just one method or indicator when making trading decisions.
Forex traders analyzing currency charts with various technical indicators
Charts are the foundation of technical analysis. They visually represent price movements over time. Here are the three main types of charts you'll encounter in Forex trading:
The simplest form of chart that connects closing prices over a specified time period. Great for identifying overall trends but lacks detail about price action within the period.
Provides more information than line charts, showing the open, high, low, and close (OHLC) for each period. Each bar represents one period of trading.
The most popular among Forex traders. Similar to bar charts but more visually intuitive, with colored "candles" showing price movements and market sentiment.
Comparison of line, bar, and candlestick charts in Forex trading
Want to dive deeper into chart patterns? Check out our comprehensive guide on Forex Chart Patterns that every trader should know.
Technical indicators are mathematical calculations based on price and/or volume that help traders identify trends, momentum, volatility, and other market conditions. Here are the most essential ones for Forex traders:
These help identify the direction and strength of market trends:
Smooth out price data to identify trends. Common types include Simple Moving Average (SMA) and Exponential Moving Average (EMA). The 50-day and 200-day MAs are particularly watched.
Shows the relationship between two moving averages. Consists of the MACD line, signal line, and histogram. Helps identify trend direction and momentum.
These measure the speed of price movements and help identify overbought or oversold conditions:
Oscillates between 0 and 100. Typically, readings above 70 indicate overbought conditions, while readings below 30 indicate oversold conditions.
Compares a currency pair's closing price to its price range over time. Also identifies overbought/oversold levels with values above 80 and below 20 respectively.
These measure the rate of price movements, regardless of direction:
Consist of a middle SMA with upper and lower bands that adjust to market volatility. Prices tend to bounce between the bands, and breakouts often signal significant moves.
Measures market volatility by decomposing the entire range of an asset price for that period. Helps in setting stop-loss levels based on current volatility.

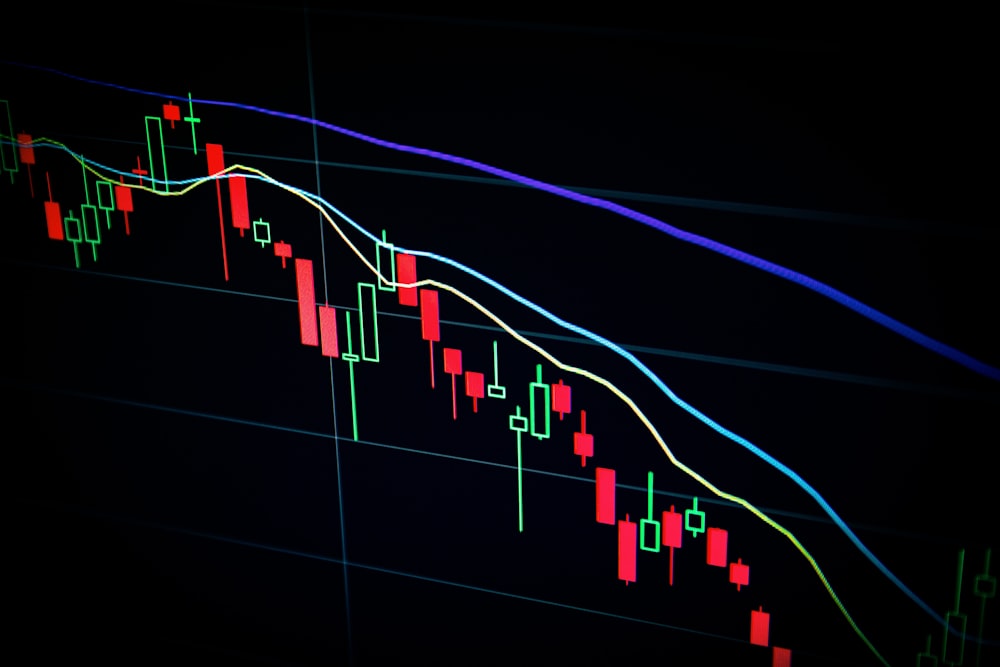
Example of RSI, MACD, and Bollinger Bands applied to a Forex chart
Chart patterns are distinctive formations created by price movements that traders use to predict future price direction. Recognizing these patterns can give you an edge in the markets:
Signal that a trend may be about to change direction:
A bearish reversal pattern with three peaks - the middle one (head) being the highest and the two others (shoulders) being lower and roughly equal in height.
Double Top is a bearish reversal pattern after an uptrend (two peaks at similar levels). Double Bottom is the bullish counterpart after a downtrend.
Suggest that the current trend will resume after a period of consolidation:
Short-term consolidation patterns that show a small counter-trend move before the prior trend resumes. Flags are rectangular, pennants are small symmetrical triangles.
Symmetrical, ascending, and descending triangles represent pauses in trends where the market builds energy before breaking out in the direction of the prior trend.
For a more detailed exploration of chart patterns with real examples, visit our Chart Patterns Guide that includes entry and exit strategies for each pattern.
Support and resistance are fundamental concepts in technical analysis that represent key price levels where the forces of supply and demand meet:
A price level where buying interest is sufficiently strong to overcome selling pressure, causing the price to stop falling and potentially reverse higher.
The opposite of support - a price level where selling pressure overcomes buying pressure, causing the price to stop rising and potentially reverse lower.
When a resistance level is broken, it often becomes support, and vice versa. This concept is crucial for identifying key levels in the market.
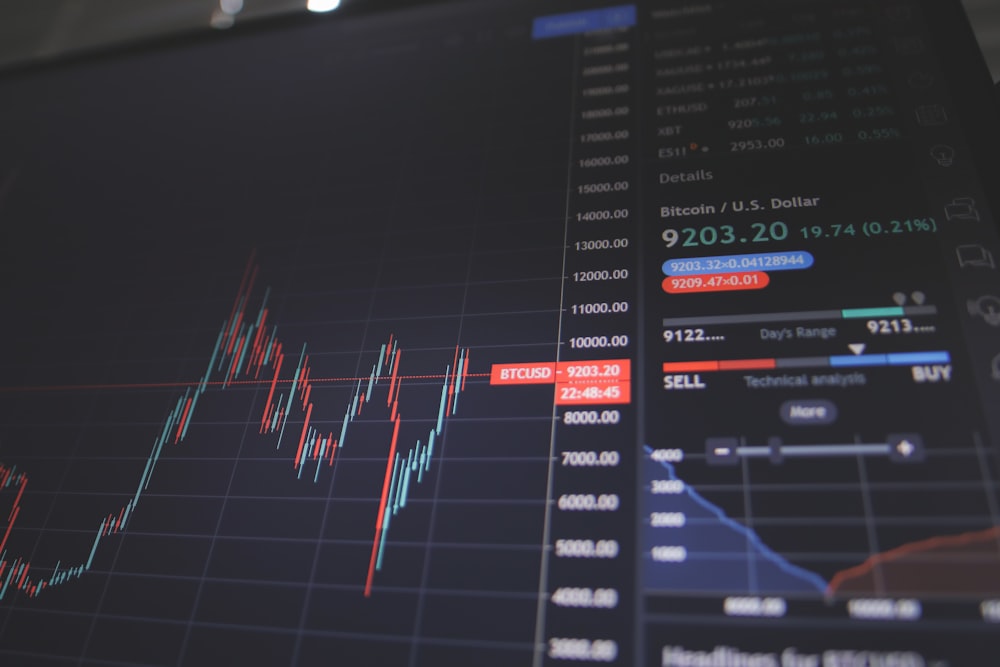
Identifying support and resistance levels on a EUR/USD chart
Developed in 18th century Japan for rice trading, candlestick patterns provide valuable insights into market psychology and potential reversals:
When open and close are virtually equal, showing indecision. Different types (dragonfly, gravestone, long-legged) provide additional context.
A bullish reversal pattern in downtrends with small body and long lower wick, showing rejection of lower prices.
Looks like a hammer but appears in uptrends as a potential bearish reversal signal.
Bullish engulfing (after downtrend) and bearish engulfing (after uptrend) show strong reversal potential as the second candle "engulfs" the first.
Three-candle reversal patterns. Morning star (bullish) appears after downtrend, evening star (bearish) after uptrend.
Two-candle patterns showing potential reversals. Piercing line is bullish, dark cloud cover is bearish.
New to Forex trading? Our Forex Trading 101 course covers all the basics you need to get started, including detailed explanations of candlestick patterns with real-world examples.
Based on the Fibonacci sequence, these tools help identify potential support/resistance levels and price targets:
Identifies potential reversal levels during pullbacks in a trend (23.6%, 38.2%, 50%, 61.8%, 78.6%). The 38.2% and 61.8% levels are most watched.
Projects potential profit-taking levels beyond 100% of a move (127.2%, 161.8%, 261.8%, 423.6%). Helps set price targets.
Diagonal support/resistance lines drawn from extreme points at Fibonacci angles (usually 38.2°, 50°, and 61.8°).
Vertical lines spaced according to Fibonacci numbers to predict potential reversal times (not price levels).

Fibonacci retracement levels showing potential support during a pullback
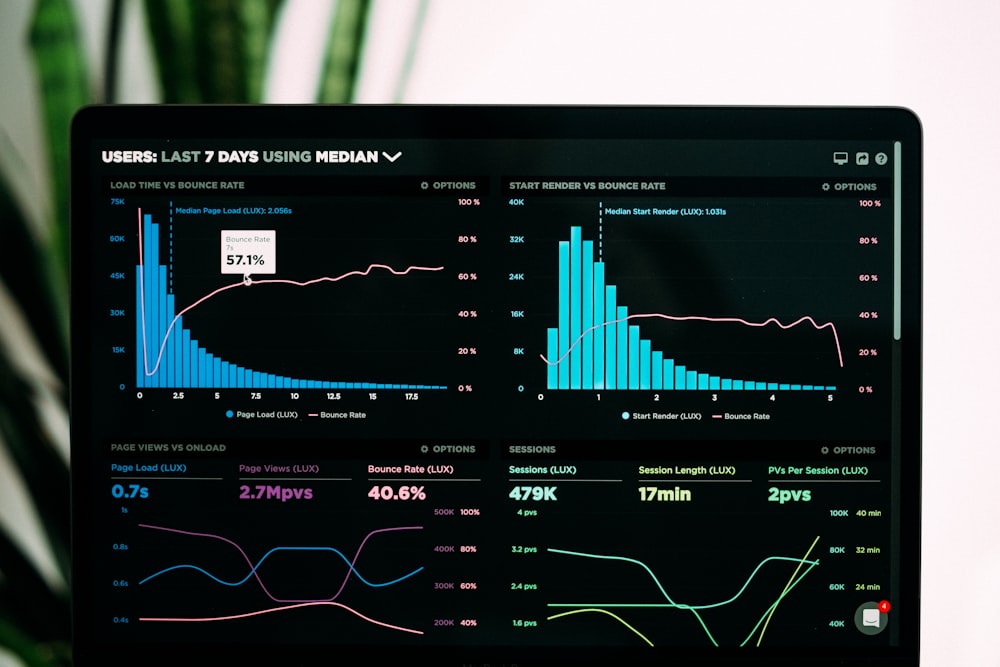
While Forex is a decentralized market without centralized volume data, these proxies help gauge trading activity:
Counts the number of price changes (ticks) during a given period as a proxy for actual volume. More ticks suggest higher activity.
A cumulative indicator that adds volume on up days and subtracts volume on down days to show whether volume is flowing in or out.
Combines price and volume to show the relationship between the two. Helps confirm trends or warn of potential reversals.
Understanding Forex market sessions is crucial for volume analysis. Learn how to trade with the world clock in our guide: Mastering Forex Trading with the World Clock.
Pivot points are popular intraday indicators calculated from the previous day's high, low, and close to identify potential support/resistance levels:
Calculates the main pivot point (P) and three support (S1-S3) and resistance (R1-R3) levels using the formula: P = (H + L + C)/3
Uses Fibonacci multipliers instead of fixed multipliers for support/resistance levels. Popular among Forex traders.
Creates eight levels (four support, four resistance) with tighter spacing, designed for range-bound markets.
Analyzing the same currency pair across different time frames provides a more comprehensive view of the market:
Most traders use a top-down approach, starting with higher time frames to identify the overall trend before drilling down to lower time frames for precise entries.
Weekly (trend) → Daily (entry) → 4-hour (timing)
Daily (trend) → 4-hour (entry) → 1-hour (timing)
4-hour (trend) → 1-hour (entry) → 15-minute (timing)
1-hour (trend) → 15-minute (entry) → 5-minute (timing)
The key is to ensure alignment - trading in the direction of the higher time frame trend generally provides better odds. Look for confluences where multiple time frames show the same signal.
Now that we've covered the essential tools, here's how to organize them into a cohesive trading approach:
If you're just starting out, our Stock Market Basics course provides a solid foundation before diving into more advanced technical analysis techniques.
Join our community of traders and get access to premium courses, live trading sessions, and expert mentorship to accelerate your learning curve.
Start Learning Now Browse CoursesTechnical analysis is both an art and a science. While these tools provide valuable insights, remember that no indicator or pattern works 100% of the time. The key to success lies in:
Start by mastering a few tools from each category we've discussed, then gradually expand your toolkit as you gain experience. Many successful traders focus on just 2-3 reliable setups they've thoroughly tested.
Remember, technical analysis is about probabilities, not certainties. Your goal isn't to be right on every trade, but to maintain a positive expectancy over many trades by combining these tools with sound money management.
If you're new to Forex trading in India, our Step-by-Step Guide to Legal Forex Trading in India covers everything from regulations to account setup.

Discover the top-rated Forex trading platforms that comply with Indian regulations and offer the tools you need for successful trading.
Read More
Easy-to-implement Forex trading strategies that new traders can use to begin their journey in the currency markets.
Read More
Stay compliant with the latest RBI regulations governing Forex trading in India to ensure your trading activities remain legal.
Read More